Electrocochleography (ECochG)
Evoked Potentials Guides
Overview
The ECochG is a specialized evoked potential that is a measure of the electrical activity in the cochlea. It is made up of the cochlear microphonic (CM), the summating potential (SP), and the action potential (AP) of the eighth cranial nerve. The AP is the Wave I of the ABR. The origin or source of the ECochG is the cochlea therefore the electrode of choice is one that is placed as close to the cochlea as possible.
The ECochG has been used to assist in the diagnosis of Meniere’s Disease, Auditory Neuropathy, and SSCD (Superior Semicircular Canal Dehiscence). It is also used to monitor the success of SSCD repair surgery. The ECochG may be used to identify Wave I when it is not detected with traditional ABR surface electrodes.
Surface electrodes placed on the mastoid or earlobe as used for ABR are not suitable for collecting an ECochG. An electrode that gets close to the cochlea is recommended.
Needle electrodes are inserted through the tympanic membrane with the tip resting on the promontory (medial wall of the middle ear) and are held in place by the insert earphone foam tips. This electrode yields the largest ECochG recordings. However, due to the invasive nature of this procedure it is not routinely used in audiology clinics.
The TM electrode is inserted into the ear canal until it touches the eardrum. The patient may hear a “thud” or feel the placement. The electrode is held in place by the insert earphone. It is important to follow manufacturers recommendations when using this electrode type. This electrode yields larger ECochG recordings than the TipTrodes.
With this electrode type, the yellow foam tip is covered with gold foil and serves as the electrode and delivers the stimulus to the ear. For best results, the gold foil tip should be inserted as deep as possible into the ear canal with the foam tip flush with the edge of the ear canal.
The location of the electrode sites will depend on the type of electrode used. For TipTrodes, use a small amount of NuPrep on a cotton swab and clean the outer third of the ear canal prior to placing the gold tip. With a TM Electrode, it is not possible to scrub the TM therefore expect the impedance levels to be higher for this type of electrode (often higher than 20kOhm.) Use a small amount of electron gel on the tip of the electrode to facilitate insertion.
A ‘horizonal’ montage is recommended and means the non-inverting (+) electrode is placed on the non-test ear rather than the forehead. Manually change the TM electrode and the active electrode when test ear is changed.
Commonly Used Right Ear Montage

Commonly Used Left Ear Montage

Common Test Settings
- Stimulus: Click
- Duration: 100 usec
- Phase: Alternating Polarity
- Intensity: 90-95 dBnHL
- Transducer: Insert Earphones
- Rate*: 7.1 clicks/sec
- Sweeps: 1024, replicated
- Gain: 50k if using TM electrodes; 100k if using TipTrodes
- High Pass Filter: 10 Hz
- Low Pass Filter: 1500 Hz
- Window: 5 msec
*Note: Slow rates enhance earlier AEP waveforms components such as the AP (Wave I) of the ECochG. When it is difficult to identify the SP component, increasing the rate to 99.1/sec may assist as the SP remains and appears more prominent as the AP diminishes.
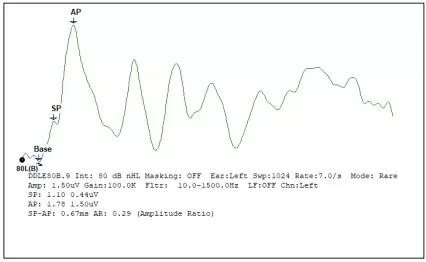
There are 3 markers for ECochG:
- Baseline (Base): Also defined as the ‘start of the SP.” Approximate latency 0.5 msec.
- SP or Summating Potential: Approximate latency 0.70 to 0.90 msec
- AP or Compound Action Potential (same as Wave I of the ABR): approximate latency 1.5-1.80 msec.
There are two measures that may be used when interpreting ECochG test results:
The SP/AP Amplitude Ratio is the most common measure used when interpreting the ECochG result. The formula for the amplitude ratio is the Amplitude of the SP/Amplitude of the AP. To obtain the measure, label the Base, AP, and SP to determine the amplitude of SP and AP. To obtain a percentage, multiply the ratio by 100. In this example the ratio is 29%.
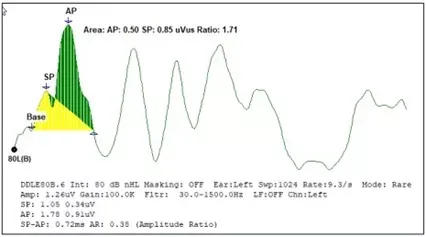
The SP/AP Area Ratio can be calculated by some evoked potential systems for interpreting ECochG results. In the example below, both the amplitude ratio (.38 or 38%) and area ratio (1.71) are calculated.
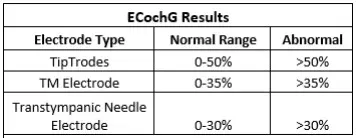
Normative data for amplitude ratio varies depending on the type of electrode used during data collection. Commonly used normal ranges are (Hall and Mueller, 1997):
For SP/AP Area Ratio, an area ratio greater than 1.94 is considered abnormal. (Al-Momani, et all 2009).