What are the Components of Admittance and When Should They be Used Clinically?
Middle ear testing has been a standard component in audiometric evaluations for many years. It is performed regularly to objectively document the compliance of the middle ear system, monitor chronic middle ear fluid, evaluate Eustachian tube function, and used in combination with the audiogram to develop a complete picture of a patient’s hearing. In the majority of cases, using the total admittance (Y) obtained with the 226 Hz probe tone provides sufficient information for basic diagnosis. This is the fastest way to “confirm” a normal middle ear system. However, when a more critical look at the middle ear is required, higher frequency probe tones and individual admittance components can provide detailed information.
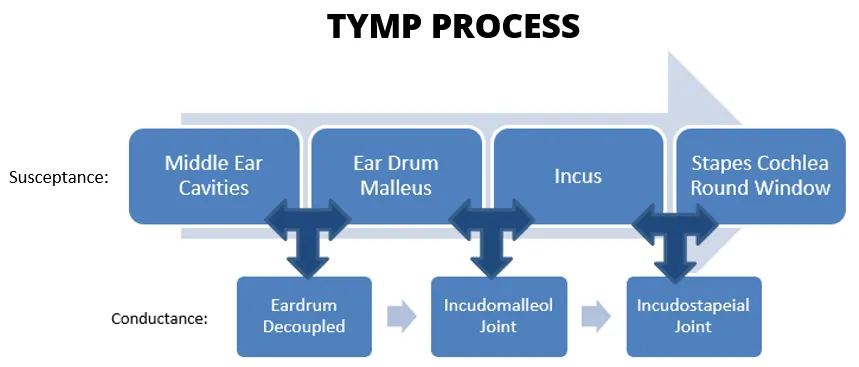
Middle ear testing has been described as evaluating the impedance of the ear. Impedance refers to the opposition of the flow of energy. In other words, if energy (sound) is introduced to a system (ear), how much of the energy is blocked or impeded. Impedance is not a practical measurement for an office setting, so the commercial impedance bridges are actually measuring admittance which is the inverse of impedance. Admittance is measuring the ease at which energy (sound) flows through the system (ear). Admittance (Y) is a measurement taken at the plane of the tympanic membrane and is made up of two components: susceptance (B) and conductance (G).
Susceptance (B) is referred to as the “stiffness” of the middle ear system and refers to the relationship between the springy parts and the mass of the middle ear. In other words, this is the way the ligaments, tendons, and muscles work with the bones in the middle ear to transmit sound. Typical middle ear testing at 226 Hz probe tone provides very predictable and reliable results using the total admittance (Y). There is no need to separate the individual components because the total admittance (Y) is equal to the susceptance (B) at that probe tone. Research has shown that when using the 226 Hz probe tone, the springy portion of the susceptance is transmitting the sound through the system.
The ear is a machine with working parts, and therefore there will be a natural amount of energy lost. Conductance (G) refers to the loss of energy due to friction in the system.
As the frequency of a stimulus is increased and gets closer to the resonance frequency of the ear, there is a natural evolution of the morphology of the tympanogram. These changes in the tympanogram are expected and follow a general rule. Sound is being transmitted be the springy portion of the ear with a low frequency probe tone (226 Hz) and the resulting tympanogram will by the typical type A. As you move to a mid-frequency probe tone (such as 678 or 1000 Hz), the mass portion of susceptance is more involved with sound transmission and the resulting tympanogram will develop multiple peaks or notches. At the resonance frequency of the ear, the tympanogram will have multiple peaks and is described as an inverted W. When using a high frequency probe tone that is above resonance frequency, the tympanogram will continue to evolve into a V shape (opposite of 226 Hz) because the mass portion of susceptance is transmitting the sound.
For basic diagnosis of middle ear function, the 226 Hz probe tone is completely appropriate. When a more detailed look at the individual components of the middle ear is required, 678 Hz should be the “go to” probe tone frequency. Tympanometry with 678 Hz is typically performed when the audiologic results don’t add up. Examples of when to use 678 Hz probe tone tympanometry are:
The 1000 Hz probe tone is utilized for the basic evaluation of the infant ear because the middle ear structure in patients under 6 months of age is different than that of patients over 6 months of age. The infant ear is mass dominated and has a lower resonance frequency which can create complex morphology and notching when using a low frequency probe tone. The 1000 Hz probe tone is far away from the resonance frequency of the infant ear and will result in more predictable morphology that is consistent with common middle ear pathologies for the infant patient population.
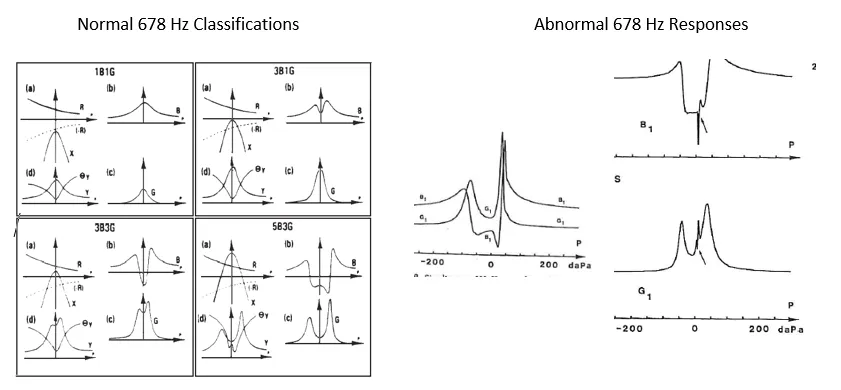
When using probe tones other than 226 Hz, susceptance and conductance should be viewed simultaneously. Baseline, or compensated, is not used. The shape of the tympanogram is classified by the number of peaks, or extremum, that are present in B and G. There are four normal classification types: 1B1G, 3B1G, 3B3G, and 5B3G. Examples of normal B/G tympanograms are shown below. Tympanograms are considered abnormal if there are too many peaks or if the peaks are too wide. See examples below of abnormal B/G tympanograms. These results often help distinguish between ossicular discontinuities and other disorders – even when no abnormality is present on the 226 Hz tympanogram.
For 1000 Hz probe tones, refer to normative data and look for any discernable peak.