How does Multi-Hz Testing Work with the TympStar Pro?
The Multi-Hz test gives audiologists a quick way to find the resonant frequency of the middle ear to help identify ossicular discontinuities and fixation disorders. Diagnostically, this can be employed to document pre and post-surgery for ossicular disorders to confirm success for the patient and physician. Before we take a look at how the device performs this test, let’s do a brief review.
Middle ear testing has been a standard component in audiometric evaluations for many years. It is performed regularly to objectively document the compliance of the middle ear system, monitor chronic middle ear fluid, evaluate Eustachian tube function and used it in combination with the audiogram to develop a complete picture of a patient’s hearing. In most cases, using the total admittance (Y) obtained with the 226 Hz probe tone provides enough information for basic diagnosis. This is the fastest way to “confirm” a normal middle ear system; however, when a more critical look at the middle ear is required, higher frequency probe tones, resonant frequency testing and individual admittance components can provide detailed information.
Middle ear testing has been described as evaluating the impedance of the ear. Impedance refers to the opposition of the flow of energy; in other words, if energy (sound) is introduced to a system (ear), how much of the energy is blocked, or impeded. Impedance is not a practical measurement for an office setting, so the commercial impedance bridges are measuring Admittance, which is the inverse of impedance. Admittance is measuring the ease at which energy (sound) flows through the system (ear). Admittance (Y) is a measurement taken at the plane of the tympanic membrane and is made up of two components, susceptance (B) and conductance (G). Susceptance (B) is also called the “stiffness” of the middle ear system and refers to the relationship between the springy parts and the mass of the middle ear. In other words, this is the way the ligaments, tendons, and muscles work with the bones in the middle ear to transmit sound. Typical middle ear testing at 226 Hz probe tone provides very predictable and reliable results using the total admittance (Y). There is no need to separate the individual components because at that probe tone, the total admittance (Y) is equal to the susceptance (B). Research has shown that when using the 226 Hz probe tone, the springy portion of the susceptance is transmitting the sound through the system. Conductance (G) refers to the loss of energy due to friction in the system. Resonance frequency testing shows us where the springy and mass components have equal contribution and the system is most efficient for energy transfer. The ear is a machine with working parts; therefore, there will be a natural amount of energy lost.
To run the Multi-Hz test, simply navigate to it from the “More” menu on the device. Once completed, the first three tabs will contain Multi-Hz test data.
The 226 Hz Y tympanogram
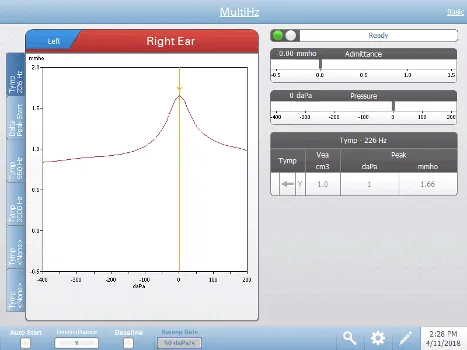
The 226 Hz tympanogram displays on the graph and the numerical results display in a table on the lower right side of the screen. The Tymp column displays the direction of the pressure sweep and the component that is being shown on the tympanogram. The Vea column displays the acoustic equivalent volume (in cm3 ). The Peak column displays the pressure (daPa) and admittance (mmho) value of the indicated peak of the tympanogram.
The difference between the B components at the Start pressure (+200 daPa) represented in the delta-peak graph
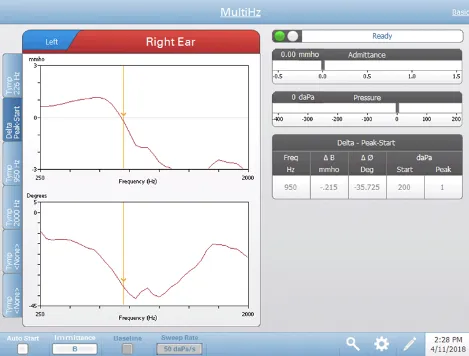
This tab contains two graphs. The top graph displays the difference between the immittance component B at the Start pressure (+200 daPa, default) and Peak pressure as a function of frequency (ΔB). The bottom graph displays the difference between the phase angle at the Start pressure and Peak pressure as a function of frequency (ØB). The resonance frequency of the ear is automatically identified by the cursor on the graphic displays where ΔB crosses 0 mmhos. The Delta Peak-Start table contains the numerical values for the graphical results obtained at resonant frequency. The table includes the resonant frequency (Hz), ΔB (mmho), and ØB (degrees). The starting pressure and peak in daPa are also displayed.
The Peak pressure and the resonant frequency tympanogram
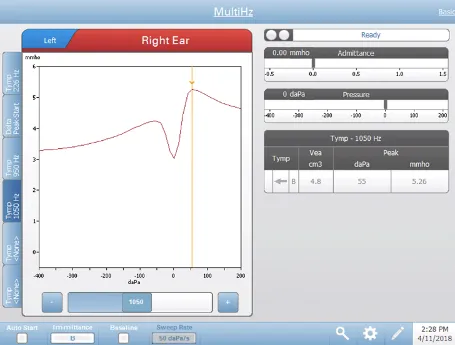
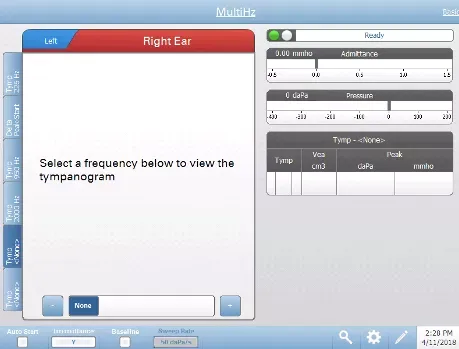
The tympanogram obtained at resonant frequency is displayed in the graph (immittance component B). The table on lower right side of the graph displays the results of the measurement. The header of the table indicates the resonant frequency. In the remaining three tabs, It is possible to display additional tympanograms at any probe tone between 250 and 2000 Hz in 50 Hz increments. Users may select an empty tab(s) and press the +/ – buttons or drag the slider bar until the desired tympanogram appears. Repeat for Tab 5 and 6 if desired.
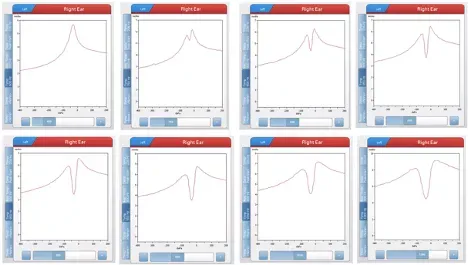
The shape of the tympanogram is very predictable and consistent when using the 226 Hz probe tone. As the probe tone increases toward resonance frequency, there will be notching in the tracing - this is because the mass (bones) portion of susceptance are contributing to sound transmission. The morphology of the tympanogram will be an upside-down W or an M at resonance frequency. As the probe tone increases higher than resonance frequency, the tympanogram will continue to evolve into a V shape (mass portion of Susceptance transmitting sound).